flowcharting-repository
Manuals and repo for plugin flowcharting
Project maintained by algenty Hosted on GitHub Pages — Theme by mattgraham
Tooltips
Enable popup when curors is on shape with date, metrics and graph preview
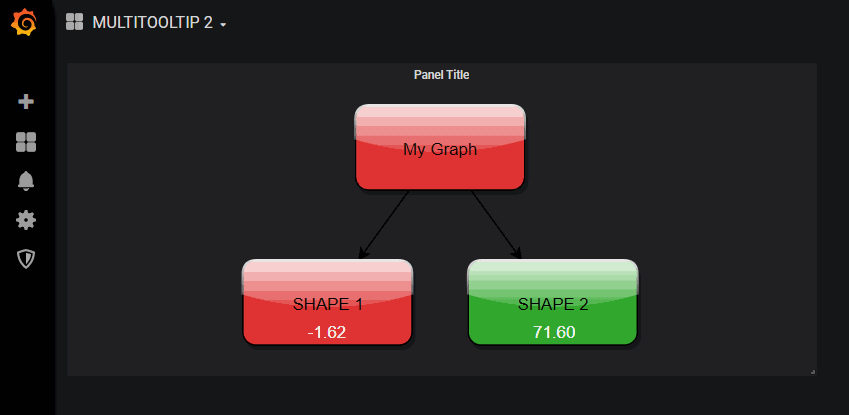
Display metrics
Enable tooltips, only the shapes targeted in the “Color/Tooltip Mappings” section will be concerned.
Label
If empty, the default label takes the value of the metric’s name.
When state is
Define the condition for displaying the tooltip. - Alway : open tooltip when mouse’s cursor is over. - Warning/Critical : Only when the status is greater than 0
Direction
If you display more than one piece of information in a tooltip, you have the possibility to display this information horizontally or vertically.
Color
The value of the metrics is displayed according to the color defined in thresholds section.
Graph
Display preview graph in tooltip